Deriv Even/Odd & Over/Under Strategy Guide 2026 (Step-by-Step)
If you've searched "deriv even odd strategy that works" or "deriv over under strategy step by step," you've probably noticed the same problem: most guides explain the contract types, but stop short of giving you an actual, repeatable set of entry conditions.
This guide fixes that. Below are complete, structured strategies for Even/Odd and Over/Under — the exact conditions to look for, when to enter, and how to manage risk around each one. Every condition here can be read live, for free, on the ProfitMax Digits panel for manual trading — or run automatically as a bot on ProfitMax NextGen once you've learned the pattern.
Before You Start: How These Strategies Read the Market
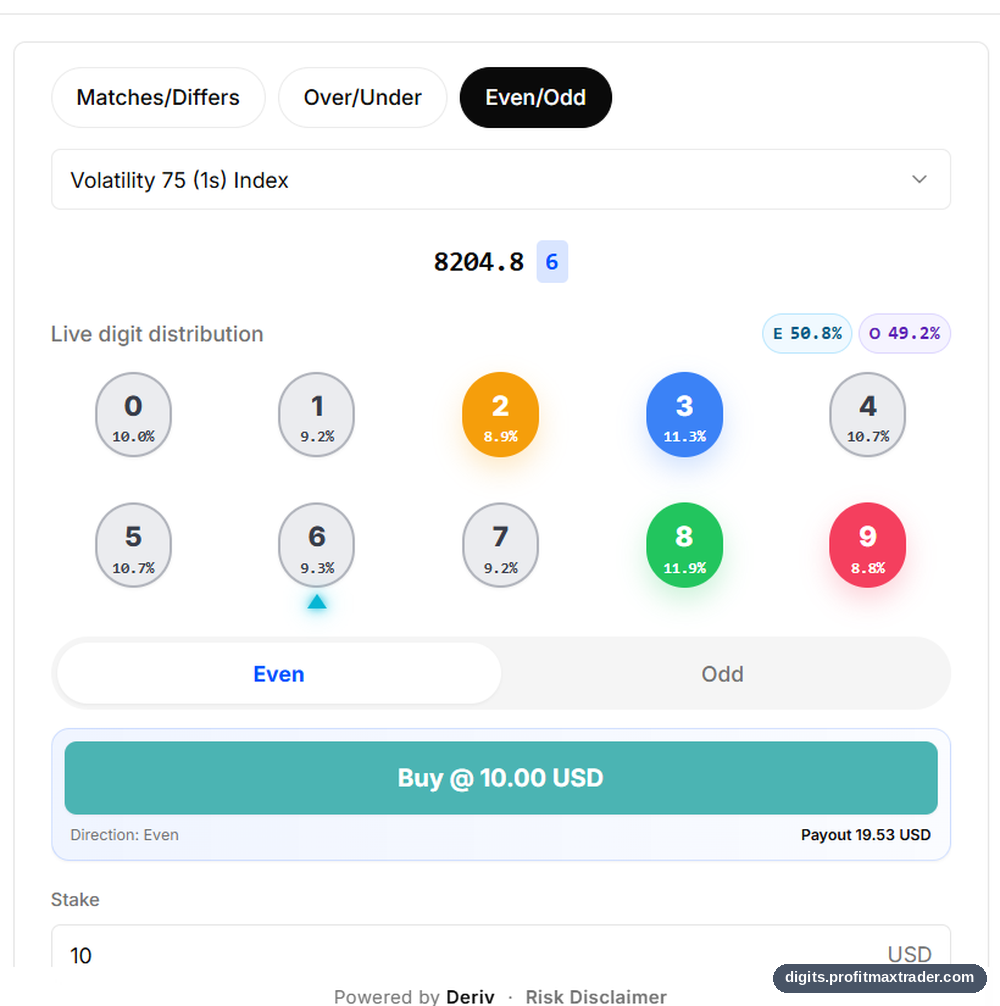
Every strategy on this page is built around digit percentage — how often each digit (0–9) has appeared in recent ticks. On ProfitMax Digits, this is shown live as four color-coded markers:
🟢 Green — the most frequently appearing digit right now
🔵 Blue — the second most frequent
🟡 Yellow — the second least frequent
🔴 Red — the least frequent digit right now
These conditions describe the current state of recent ticks — they are not a forecast. Synthetic indices generate each tick independently, so past digit frequency does not change the odds of the next one. Every strategy below is a structured way to read that state and act consistently — not a guaranteed-win system. Treat it as one input alongside stake discipline and a defined stop point.
EVEN/ODD STRATEGY
EVEN Strategy — Conditions to Consider
Blue & Green should both be on EVEN digits.
Both Green and Blue bars should have percentages above 11%.
Red & Yellow should either be on ODD digits, or a mix of ODD/EVEN.
Red bar: 8.6% or below.
Yellow bar: 9.5% or below.
Entry Point
Once the conditions above are met, watch for the tick pointer to land on the ODD digit among the least-appearing pair (Red & Yellow) — that's your trigger. From there, the very first EVEN digit that appears within the next 3 ticks confirms the entry immediately — there's no requirement for a second ODD tick first. If no EVEN digit appears within those 3 ticks, the window expires and you go back to watching for a new trigger.
Dominance Gap — Context Only
The EVEN vs ODD pressure split shown on screen is for context only. It does not determine whether a setup is valid, and it does not affect when an entry confirms — only the conditions and entry point above do that.
Run Management
After 3 to 7 profitable runs, stop the bot to confirm market conditions before waiting for another entry trigger. This is a manual guideline for the trader to follow — it is not automatically tracked or enforced by the tool.
ODD Strategy — Conditions to Consider
Green & Blue bars should both be on ODD digits, both above 11%.
Red & Yellow bars should both be on EVEN digits.
Red bar: 8.6% or below.
Yellow bar: 9.5% or below.
Entry Point
Watch for the tick pointer to land on the least-appearing digit among Red & Yellow (that's Red, since it's always the single least-frequent digit) — that's your trigger. From there, wait for 2 consecutive ODD ticks within the next 5 ticks; the moment the second consecutive ODD lands, that confirms the entry.
Dominance Gap — Context Only
The EVEN vs ODD pressure split shown on screen is for context only. It does not determine whether a setup is valid, and it does not affect when an entry confirms — only the conditions and entry point above do that.
Run Management
After 3 to 7 profitable runs, stop the bot to confirm market conditions before waiting for another entry trigger. This is a manual guideline for the trader to follow — it is not automatically tracked or enforced by the tool.
OVER/UNDER STRATEGY
OVER Strategy — Conditions to Consider
Digits 0, 1, 2, 3 all below 10% → qualifies as Over 3. If only 0, 1, 2 are below 10% (digit 3 can be anything) → qualifies as the tighter Over 2.
At least one of Red or Yellow (least/2nd-least appearing) must fall within 0–3.
At least two digits in the 4–9 range must be at 11% or higher, and Green/Blue must both fall within 4–9.
Entry Point
The trigger digit is whichever of 1, 2, or 3 currently has the lowest percentage. Watch for the tick pointer to touch that digit — that's the trigger. The very next tick after that must land in the 4–9 range to confirm the entry.
Dominance Gap — Context Only
The pressure split shown on screen is for context only. It does not determine whether a setup is valid, and it does not affect when an entry confirms — only the conditions and entry point above do that.
Run Management
After 3 to 7 profitable runs, stop the bot to confirm market conditions before waiting for another entry trigger. This is a manual guideline for the trader to follow — it is not automatically tracked or enforced by the tool.
UNDER Strategy — Conditions to Consider
Digits 9, 8, 7, 6 all below 10% → qualifies as Under 6. If only 9, 8, 7 are below 10% (digit 6 can be anything) → qualifies as the tighter Under 7.
At least one of Red or Yellow must fall within 6–9.
At least two digits in the 0–5 range must be at 11% or higher, and Green/Blue must both fall within 0–5.
Entry Point
The trigger digit is whichever of 6, 7, or 8 currently has the lowest percentage. Watch for the tick pointer to touch that digit — that's the trigger. The very next tick after that must land in the 0–4 range to confirm the entry.
Dominance Gap — Context Only
The pressure split shown on screen is for context only. It does not determine whether a setup is valid, and it does not affect when an entry confirms — only the conditions and entry point above do that.
Run Management
After 3 to 7 profitable runs, stop the bot to confirm market conditions before waiting for another entry trigger. This is a manual guideline for the trader to follow — it is not automatically tracked or enforced by the tool.
Trade It Manually, or Automate It
Everything in this guide works two ways:
Trade It Manually
Watch the Green/Blue/Yellow/Red conditions yourself and enter by hand when they align. This is the best way to actually learn the pattern before automating anything.
Open ProfitMax Digits → Free, real-time digit percentages for every Volatility Index, no login required to view.
Automate It With a Bot
Once you're confident reading these conditions manually, the same entry logic can run as an automated bot — checking Green/Blue/Yellow/Red conditions every tick and entering exactly when they align, without you watching the screen.
Open ProfitMax NextGen → Build or load a bot on the full trading terminal, powered by Deriv API.
A Note on Risk
No condition described here changes the underlying odds of a synthetic index — each digit still has an independent probability on every tick, and Deriv's own edge is built into every contract's payout. This guide gives you a consistent way to read current market state and act with discipline, whether by hand or automated — it does not guarantee a win. Always:
Test any strategy on a demo account first
Stake only what you're fully prepared to lose
Treat this guide as one input among several, not a system to follow blindly
Get Started
Manual trading: digits.profitmaxtrader.com Bots & automation: trade.profitmaxtrader.com
Free, real-time, no login required to view — read the exact Green/Blue/Yellow/Red conditions from this guide live, whichever way you choose to trade.
Trading involves risk. Nothing in this article is financial advice. Demo first.